


I quote the conservative John Mauldin infrequently, but mainly when he makes unpleasant points about the economy backed up by lots of data. The reason for this is that he is known for being a voice of calculated optimism (for the upper classes mostly), but today his optimism has almost evaporated (and, of course, it's right before the Primaries so "suck on that," Tom Friedman).
Orders and Production: No Time for Complacency
John MauldinAug 06, 2012
 Source: Federal Reserve Banks of New York, Philadelphia, Richmond, Kansas City and Dallas, Institute for Supply Management, ISM Chicago, U.S. Department of Commerce and Wells Fargo Securities, LLC
Comparing This Recovery to Past Cycles
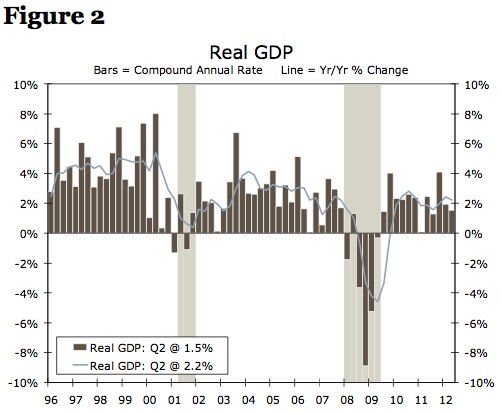
The recovery, which began in July 2009, is clearly losing momentum. U.S. economic growth slowed from a 4.0 percent rate in the fourth quarter of 2011 to a tepid 1.5 percent annual growth rate in the second quarter (Figure 2). Some parts of the economy continue to eek out modest gains, while other sectors have slipped into outright declines.
Source: Federal Reserve Banks of New York, Philadelphia, Richmond, Kansas City and Dallas, Institute for Supply Management, ISM Chicago, U.S. Department of Commerce and Wells Fargo Securities, LLC
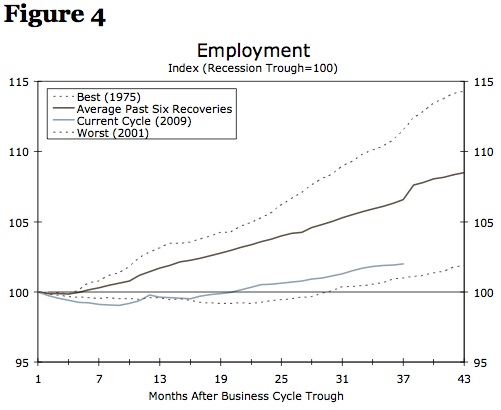
Since 1954, there have been six recoveries that have lasted at least 36 months. We compared the current recovery, which has now hit the 36-month mark, to those past six recoveries. To evaluate where we are in the cycle, we consider the four primary coincident indicators used by the National Bureau of Economic Research (NBER) when it determines whether or not the economy is officially in recession. These indicators are: employment, real income growth, real wholesale sales and industrial production. We indexed these indicators to the trough of each respective business cycle, an idea first explored by the St. Louis Federal Reserve. This method allows us to measure each of these various vital signs for the economy and consider the position of each in this cycle relative to past cycles.
Employment: Another “Jobless Recovery”?
Strictly speaking, the U.S. economy has technically transitioned from recovery to expansion. Total real GDP at present is 1.7 percent larger than its prerecession peak. However, many parts of the economy are struggling to get back to previous highs. Perhaps nowhere is this deficiency more evident than in the labor market. The U.S. economy lost 8.8 million jobs in the recession but has only recouped roughly 3.8 million of those lost jobs (Figure 3). That leaves an “employment deficit” of roughly five million jobs. Try telling one of these five million people that the economy has transitioned from recovery to expansion.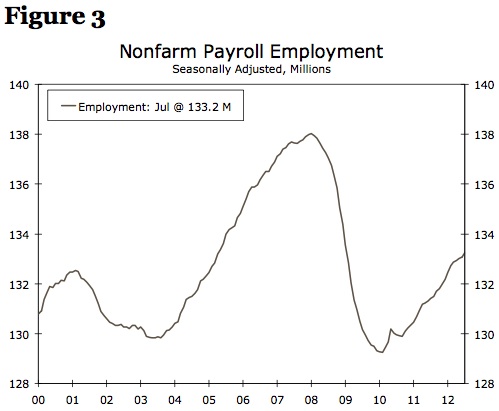 Source: U.S. Department of Labor and Wells Fargo Securities, LLC
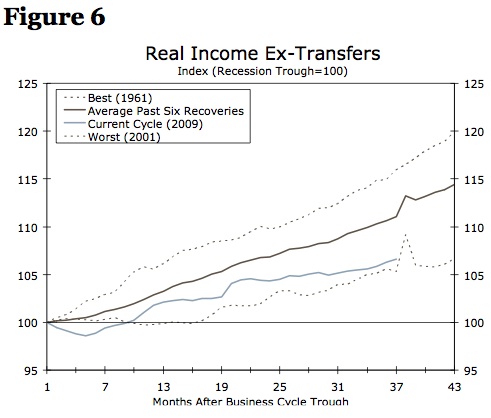
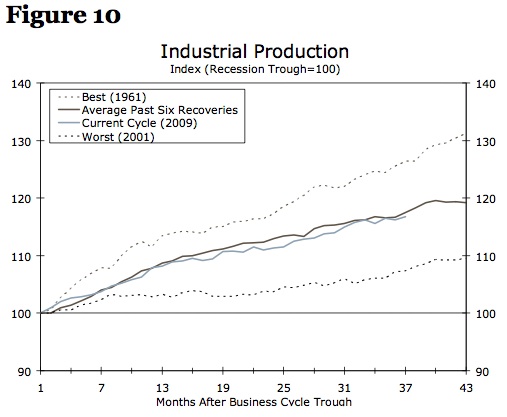
In Figure 4, we reveal the first of our charts comparing this cycle relative to the past six recoveries that have lasted at least this long in duration. Since we will repeat this chart for each of the four NBER coincident cyclical indicators, it is worth taking a second here to describe what is depicted in the chart. Each series is indexed to 100 at the trough of the cycle. The lighter solid line indicates the current expansion. The darker solid line indicates the average of the previous six expansions that have lasted at least 36 months. The two dashed lines report the best and worst values across these previous expansions. The legend in each graph identifies the date for which cycle was the “best” or “worst” expansion. Taking employment in the chart below as an example: the best jobs recovery was following the 1975 recession, the worst was following the 2001 recession and the current cycle is well below average and only slightly better than the 2001 cycle.
Source: U.S. Department of Labor and Wells Fargo Securities, LLC
Real Income: Well Below Average
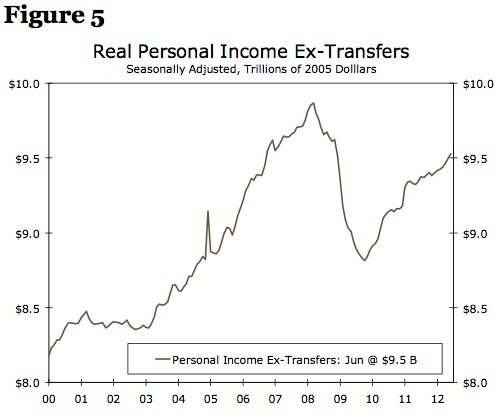
In an environment where employers have been reticent to add new workers, it comes as little surprise that income growth has been rather muted as well. Transfer payments, such as social security, unemployment insurance and food stamps, have been a key driver of income growth in this economic cycle as opposed to wages and salaries. In fact, between the prerecession peak for income in the second quarter of 2008 and June 2012, transfer payments increased 18.9 percent while over the same time period wages and salaries increased only 4.2 percent.After subtracting transfer payments and adjusting for inflation, income growth in this cycle has been close to the weakest recovery in our study. From the absolute trough of the economic cycle in June 2009, personal income less transfer payments is up just 6.6 percent. The average expansion would have posted an 11 percent recovery by this stage of the recovery.
Just as employment is still a far cry from it prerecession peak, personal income ex-transfer payments is also a shadow of its former self, still 3.4 percent smaller than its high in March 2008 (Figure 5). The weakest real income recovery in our study was the 2001 cycle, though if one looks carefully at Figure 6, one will note a spike in income about three years into that expansion. Recall that the one-time special dividend payout to shareholders of Microsoft occurred in 2004 and is the best explanation for the pop in income during that cycle. Barring a similar surge in real income in the next few months, this cycle is about to become the worst on record with respect to income growth.
Source: U.S. Department of Commerce, U.S. Department of Labor and Wells Fargo Securities, LLC
Source: U.S. Department of Commerce, U.S. Department of Labor and Wells Fargo Securities, LLC
Real Wholesale Sales Holding Up, but What Will Happen as Retail Sales Fade?
Real manufacturing and wholesale-retail trade sales is the next of our four NBER coincident indicators. Here, again, we find that, although the economy as a whole is now larger than it was before the recession, this category of sales is still clawing its way out of the hole (Figure 7). Despite having rallied 12.6 percent from its level at the depth of the recession, wholesale sales are at present 3.9 percent lower than they were before the recession began.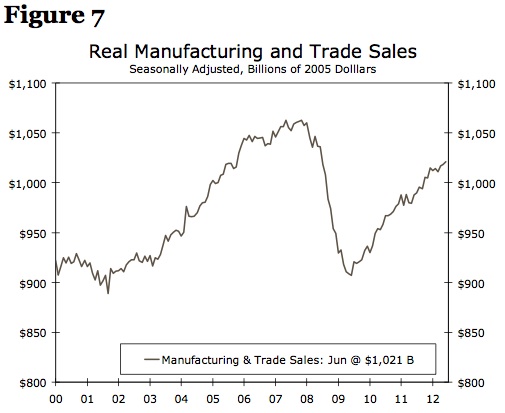 Source: U.S. Department of Commerce and Wells Fargo Securities, LLC
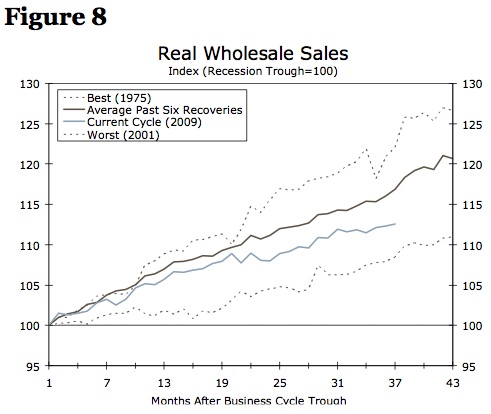 Source: U.S. Department of Commerce and Wells Fargo Securities, LLC
It comes as little surprise to learn that, in terms of how this cycle stacks up with regard to wholesale sales, the current period is below average. Yet, the current recovery in real wholesale sales compares more favorably to previous trends than the recoveries in the job market and real income. Indeed, on a threeâmonth annualized basis, this series is growing at a 4.1 percent rate through June.
This rate of growth hardly seems sustainable given the rapid deterioration in U.S. consumer spending. Retail sales have fallen for three consecutive months. Granted, the component we are focused on in this section is real manufacturing and trade sales, so retail sales will not perfectly lead this series, but a three-month backward slide for retail sales does not bode well for sales at the wholesale level. A move into negative territory in the orders component of various purchasing manager surveys suggests little support for the manufacturing portion of orders.
Industrial Production: The Only Component Firing on all Cylinders
Industrial production has been the strongest — or at least the least weak — of the four NBER business cycle indicators during this recovery. Although output has increased 16.7 percent from its recession low, it remains 3.3 percent off its prerecession peak (Figure 9). None of the four business cycle indicators have yet crested above their respective prerecession high water marks, but industrial production is the closest of the four. In terms of how it stacks up relative to previous cycles, the current run is almost a perfect retracement of the average of the other six recoveries in our study (Figure 10). Industrial production has been critical to the recovery so far.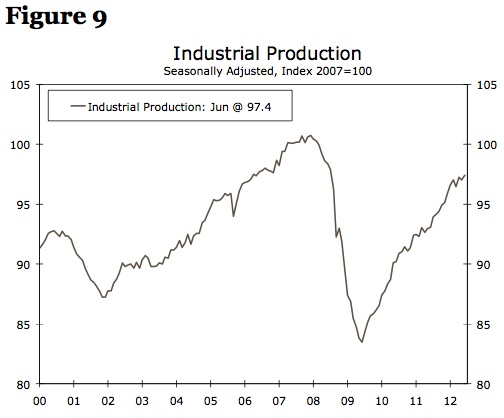
Source: Federal Reserve Board and Wells Fargo Securities, LLC
Source: Federal Reserve Board and Wells Fargo Securities, LLC
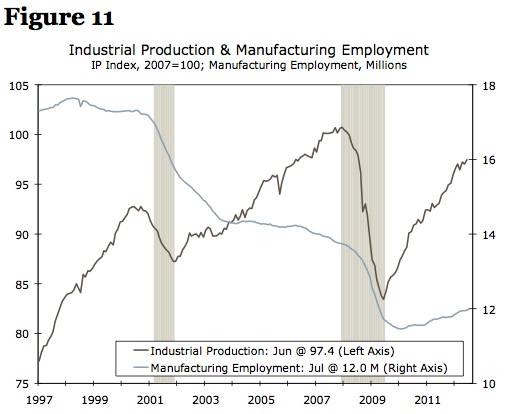
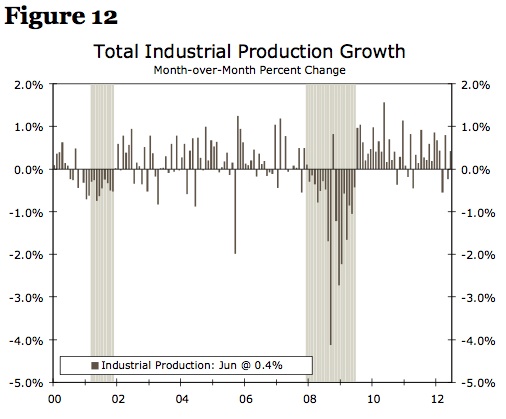
Output at the nation’s factories, utilities and mines turned positive at precisely the same time as the broader economy in the summer of 2009. It may seem somewhat unexpected that industrial production has retraced most of its recession losses while there has been little improvement in terms of manufacturing payrolls (Figure 11). Unfortunately for manufacturing workers, this was not unlike the previous recovery following the 2001 recession or several other cycles before that. In fact, the total number of workers on manufacturing payrolls peaked in 1979; this helps explain why payrolls can be so weak even as industrial production comes back in a relatively typical way. Having said that, Figure 12 shows how industrial production gains have been hit and miss, falling twice in the past four months.
Source: U.S. Department of Labor, Federal Reserve Board and Wells Fargo Securities, LLC
 Source: U.S. Department of Labor, Federal Reserve Board and Wells Fargo Securities, LLC
Where Are We Now?
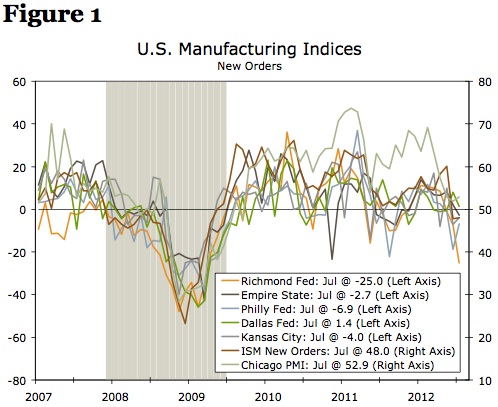
For two of these indicators, employment and income growth, this cycle has been extraordinarily weak. Given the stubbornly high unemployment rate, this probably comes as little surprise. However, for the other two indicators, industrial production and real manufacturing and trade sales, the current cycle has been fairly typical, at least until retail sales started to come unglued in April. The last remaining stalwart of growth in this cycle, at least among these four components, is industrial production. Perhaps more than at any time in the past several years, the outlook for industrial production is critical to the outlook for the overall economy. Among the key factors to consider to get a sense of what the future holds for output is what purchasing managers are saying about their orders.
The major regional and national PMI surveys include a sub-index on new orders, which provide an early look at the strength of future production. A monthly decline in the new orders component in one series may not in and of itself signal a future decline in production, but when multiple new orders indexes slip into contraction territory, it can signal broad-based weakness in the manufacturing sector and a potential decline in total economic output.
Of seven major manufacturing surveys, five signaled a decline in new orders in July. Given that these surveys cover different geographies and are based on the sentiment of respondents, orders rarely contract simultaneously in each survey on a monthly basis. Indeed, the only time all seven surveys have been in contraction territory was during a five-month period that began in October 2008. By that point, the economy was already 10 months into the recession. As a result, there is limited value in waiting for all seven indicators to go negative at the same time. What if we look instead at other periods when five or more of these new orders series—the same number currently showing a decline—first slipped into negative territory? We find a more valuable warning signal. The last time five of these orders components first went negative was February 2008, 10 months before the NBER announced that the recession began in December 2007. For the 2001 recession, the new orders indexes signaled broad weakness ahead for the economy. The new orders index for the four PMIs available at the time showed concurrent declines as early as January 2001, although the recession did not officially start until March of that year.
While the number of purchasing managers’ indexes currently signaling a decline in new orders is concerning, it is important to note that a simultaneous decline in these surveys has not always meant the onset of a recession. Looking at the four PMIs with history through the 1990s, a majority signaled declining orders in the mid-cycle slowdown of the 1990s, which did not result in a recession. Our outlook of sluggish growth reflects the softness seen in orders in many of the major PMIs, but we do not believe the economy is currently in recession.
Conclusion: Avoiding Complacency
In a world of uncertainty, it is important not to ignore the shots across the bow. As human beings, we are limited by a confirmation bias—the tendency to favor information that validates our beliefs or world view. We have been repeating our call of “slow growth, no double dip” since the outset of this recovery three years ago, and so far this has been the right call. However, we must guard against confirmation bias in our analysis. In this essay, we make the point that, because of the critical role industrial production has played in this recovery, we cannot afford to ignore evidence that orders are falling. The unraveling in orders may lead to a broader weakening in the outlook for industrial production and overall economic growth.


2 comments:
I am evermore amazed that people like that cannot understand that what we are experiencing is an orchestrated, planned demise of the US Dollar.
Manufacturing being purposefully sent overseas is planned.
The lackadaisical immigration standards (open border policy) is planned.
Taking over the car industry, then shutting down the plants here to open in China... planned.
Banks being allowed to leverage and outright fraud to the tune of TRILLIONS... planned.
If people could simply wake up to reality, maybe we would have a chance.
However, I have no hope in my fellow Americans, anymore.
Ah.
And now you've caught on to my unique news coverage here at Pottersville2.
Thanks for commenting, B!
When are you leaving?
Post a Comment