


(Special Holiday Thank You to blog followers (for a limited time: as long as I can stand at the kitchen counter) - for a $50 donation from blog followers - a gift of the home-made Swiss chard, onion, garlic, capers, cherry tomatoes, basil, oregano, pine nuts and parmesan pizza made famous on this site, will be shipped to the donor's address within the contiguous U.S.A. - sorry overseas fans. Enjoy the holidays!)

Happy Holidays from the infamous Montag and Chan Lowe(!)

And speaking of craziness (holiday-oriented or not), take a look at the video of the Republican Debate "intellectuals!"
The Republican Debate: Almost Every ‘Fact’ About Wall Street Was False
Ben Carson gets put in his proper category.
Chris and Ralph point out a little bit of Bernie history for our greater edification.
Not that we all don't love him.
And them.
VIDEO: Chris Hedges and Ralph Nader on the Complicity of Bernie Sanders
And Glennwald interviews Charlie Savage:
On Obama's "War on Terror" Legacy
And . . . just in case you missed the secret sauce on the little chunk of gristle at the center of the nauseating TPP/TTIP/TISA mixture:
The TPP is part of a triad of trade agreements that includes the Transatlantic Trade and Investment Partnership (TTIP) and the Trade in Services Agreement (TiSA). TiSA, by calling for the privatization of all public services, is a mortal threat to the viability of the U.S. Postal Service, public education and other government-run enterprises and utilities; together these operations make up 80 percent of the U.S. economy. The TTIP and TiSA are still in the negotiation phase. They will follow on the heels of the TPP and are likely to go before Congress in 2017.
These three agreements solidify the creeping corporate coup d’état along with the final evisceration of national sovereignty. Citizens will be forced to give up control of their destiny and will be stripped of the ability to protect themselves from corporate predators, safeguard the ecosystem and find redress and justice in our now anemic and often dysfunctional democratic institutions. The agreements — filled with jargon, convoluted technical, trade and financial terms, legalese, fine print and obtuse phrasing — can be summed up in two words: corporate enslavement.
The TPP removes legislative authority from Congress and the White House on a range of issues. Judicial power is often surrendered to three-person trade tribunals in which only corporations are permitted to sue. Workers, environmental and advocacy groups and labor unions are blocked from seeking redress in the proposed tribunals. The rights of corporations become sacrosanct. The rights of citizens are abolished.
The Sierra Club issued a statement after the release of the TPP text saying that the “deal is rife with polluter giveaways that would undermine decades of environmental progress, threaten our climate, and fail to adequately protect wildlife because big polluters helped write the deal.”
If there is no sustained popular uprising to prevent the passage of the TPP in Congress this spring we will be shackled by corporate power. Wages will decline. Working conditions will deteriorate. Unemployment will rise. Our few remaining rights will be revoked. The assault on the ecosystem will be accelerated. Banks and global speculation will be beyond oversight or control. Food safety standards and regulations will be jettisoned. Public services ranging from Medicare and Medicaid to the post office and public education will be abolished or dramatically slashed and taken over by for-profit corporations.
Prices for basic commodities, including pharmaceuticals, will skyrocket. Social assistance programs will be drastically scaled back or terminated. And countries that have public health care systems, such as Canada and Australia, that are in the agreement will probably see their public health systems collapse under corporate assault. Corporations will be empowered to hold a wide variety of patents, including over plants and animals, turning basic necessities and the natural world into marketable products.
And, just to make sure corporations extract every pound of flesh, any public law interpreted by corporations as impeding projected profit, even a law designed to protect the environment or consumers, will be subject to challenge in an entity called the investor-state dispute settlement (ISDS) section. The ISDS, bolstered and expanded under the TPP, will see corporations paid massive sums in compensation from offending governments for impeding their “right” to further swell their bank accounts. Corporate profit effectively will replace the common good.
Given the bankruptcy of our political class — including amoral politicians such as Hillary Clinton, who is denouncing the TPP during the presidential campaign but whose unwavering service to corporate capitalism assures her fealty to her corporate backers — the trade agreement has a good chance of becoming law. And because the Obama administration won fast-track authority, a tactic designed by the Nixon administration to subvert democratic debate, President Obama will be able to sign the agreement before it goes to Congress.
The TPP, because of fast track, bypasses the normal legislative process of public discussion and consideration by congressional committees. The House and the Senate, which have to vote on the TPP bill within 90 days of when it is sent to Congress, are prohibited by the fast-track provision from adding floor amendments or holding more than 20 hours of floor debate. Congress cannot raise concerns about the effects of the TPP on the environment. It can only vote yes or no. It is powerless to modify or change one word.
If you have any love for living in a free, democratic country that has laws which must be obeyed in order for everyone in it to be protected, then this should be a nonstarter.
And everyone should be in the streets marching against it until the very idea of it becoming the reigning American paradigm is obliterated from all cognizance.
Speaking of proper cognizance, we need to understand the real story behind the number of jobs created (and destroyed) as depicted in the October jobs report:
The October Jobs Report - Not Awesome, Just More Of The Same BLS Con
David Stockman
New York City, New York
November 9, 2015
No, it wasn’t a “blow-out” jobs report. Inside the artificially bloated, trend-cycle adjusted headline number was the same old BLS con job and an economically devastating shortfall where it really counts. Namely, the US economy still has 2% fewer breadwinner jobs than it did 94 months ago at the pre-crisis peak in December 2007.Granted, the C-suites of corporate America are virtually tethered to the stock market in pursuit of stock option winnings. But that’s on a slow-motion basis.
Actually, its worse. As is blindingly clear from the chart below, last month’s purportedly “awesome” jobs report contained 1.4 million fewer breadwinner jobs than existed way back in the very first month of this century!
So that’s not an awesome labor market; its the measure of a sick economy.
(Click on all photos to enlarge.)
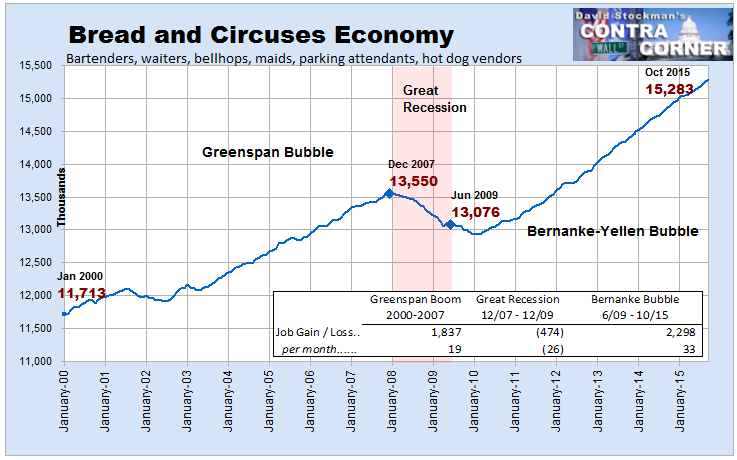
Indeed, the October pattern was even worse than normal. To wit, the reported number of high-pay, high-productivity jobs in mining, energy and manufacturing declined by 4,000, while the count of low-pay, part-time waiters and bartenders soared by 41,000.
Yes, the “Leisure and Hospitality” category of the BLS survey is somewhat broader — it also includes bellhops, hotel maids, parking attendants, hot dog vendors, stadium maintenance crews and the rest of the lodging and entertainment complex. These are all worthy and necessary endeavors, but they are mostly gigs, not jobs.
During October the average workweek in "Leisure and Hospitality" was just 26.3 hours. As a purely mathematical matter this means that a significant proportion of the job count in this category likely involved less than 20 hours per week of paid work.
Likewise, average gross earnings were just $380 per week compared to $1,035 in manufacturing, $1,385 in mining and energy and $1,604 in the utilities category. On an annualized basis, the latter category amounts to $83K, while the leisure and hospitality weekly rate annualizes to $19k or 77% less.
So there are jobs, there are gigs and there is a wide range of economic differentiation in between. But the notion that you can treat all jobs slots as economic equivalents, add them up and get anything more than statistical noise surely strains credulity.
Needless to say, this dubious metric has become the focal point of a monthly media feeding frenzy and the apparent #1 guidepost for central bank policy action. So with dumbing down like that it is virtually certain that the next economic and financial storm will come as a complete shock.
The degree of obfuscation owing to this all-jobs-the-same convention is evident in the trends in the establishment survey since January 2000. The bread and circuses jobs in the Leisure and Hospitality category, of course, are the first to be thrown overboard during recession, but they nevertheless have grown at a 1.8% per annum rate over the last 16 years.
That compares to a negative 1.5% rate for goods producing jobs and a positive 5.4% CAGR for home health workers. While it all adds up to a microscopic 0.4% annual rate for nonfarm payrolls as a whole, the resulting aggregate is self-evidently meaningless; the jobs mix has been changing radically — and for the worse — on an unrelenting trend for this entire century.
In any event, I seriously doubt that 41,000 leisure and hospitality jobs were actually created last month — owing to the blatant statistical finagling by the BLS called trend cycle adjustment. Indeed, the smoking gun is right here in the waiters and bartenders count.
As shown below, during the 26-month period between the December 2007 start of the recession and the February 2010 establishment survey bottom, this category lost an average of 26,000 jobs per month. And then, viola, during the next 26 months it gained nearly an identical amount — 29,000 per month.
Can you say bureaucrat with a straight-edge ruler? That is, the BLS methodology essentially results in drawing straight lines between cycle-inflection dot points in order to make the jobs chart look like it is moving smoothly from the lower left to the upper right.
Folks, it is not even remotely plausible that in the real world of millions of restaurants, bars, hotels, theme parks, stadiums, concert halls and all the rest that companies actually hired and fired with such lockstep regularity during the recent recession cycle drop and rebound.
Moreover since February 2010, Leisure and Hospitality job growth has averaged 34,000 per month with only minor monthly fluctuations. That is to say, the chart line from 2010 to the present was made by a statistical algorithm, not millions of real world businesses in an $18 trillion economy.
Since real world numbers would have jagged edges and frequent short-term fluctuations the implication is self-evident: The BLS is smoothing the numbers to fit an implicit Keynesian model of reality, not to measure what is actually happening.
In this context, it is worth noting that the current business cycle expansion is now in its 76th month and is therefore long in the tooth compared to the average post-war expansion of 60 months. So when the next recession arrives someday soon, expect this month’s 41,000 Leisure and Hospitality jobs to disappear into the BLS’s smoothing formula for the recession downside.
That is, it will publish a sudden monthly run of job losses, thereby eliciting shrill demands from the Keynesian Chorus and Washington politicians alike for macroeconomic “stimulus” to put America back to work. This syndrome is getting tediously predictable.
It is not surprising, therefore, that the so-called financial press actually treats these utterly fudged and manipulated monthly job change deltas seriously. That is apparently their job — to applaud the Fed’s acumen in enabling the expansion and to underscore its essential role in preventing any downturn from plunging into a permanent depression.
Consider the following report just posted by the utterly gullible Jeff Bartash from "MarketWatch." You can’t make this stuff up:
The stunning 271,000 increase in new jobs in October quelled lingering unease over a slowdown in hiring at the end of summer. The government’s employment report issued Friday also showed the strongest yearly wage gains since 2009 and the lowest unemployment rate in more than seven years..
Now that’s not to say waning job creation in August and September was a mirage. What probably happened is that businesses got nervous after a global stock market selloff that erupted amid reports of a weakening Chinese economy
The October employment report suggests executives have gotten over their anxiety, no doubt encouraged by fresh signs of steady U.S. growth and a rebounding stock market.
Some of the people they might have hired several months earlier were offered jobs in October instead.


The idea that the weekly hiring pace of HR departments among retail chains, restaurants, bars, hotels, hospitals and home health agencies — where most of the job gains occurred in October — is so fixated on the stock averages and the mindless headlines of the likes of "MarketWatch" that it shows up in the monthly BLS numbers is not just preposterous. Its downright idiotic!
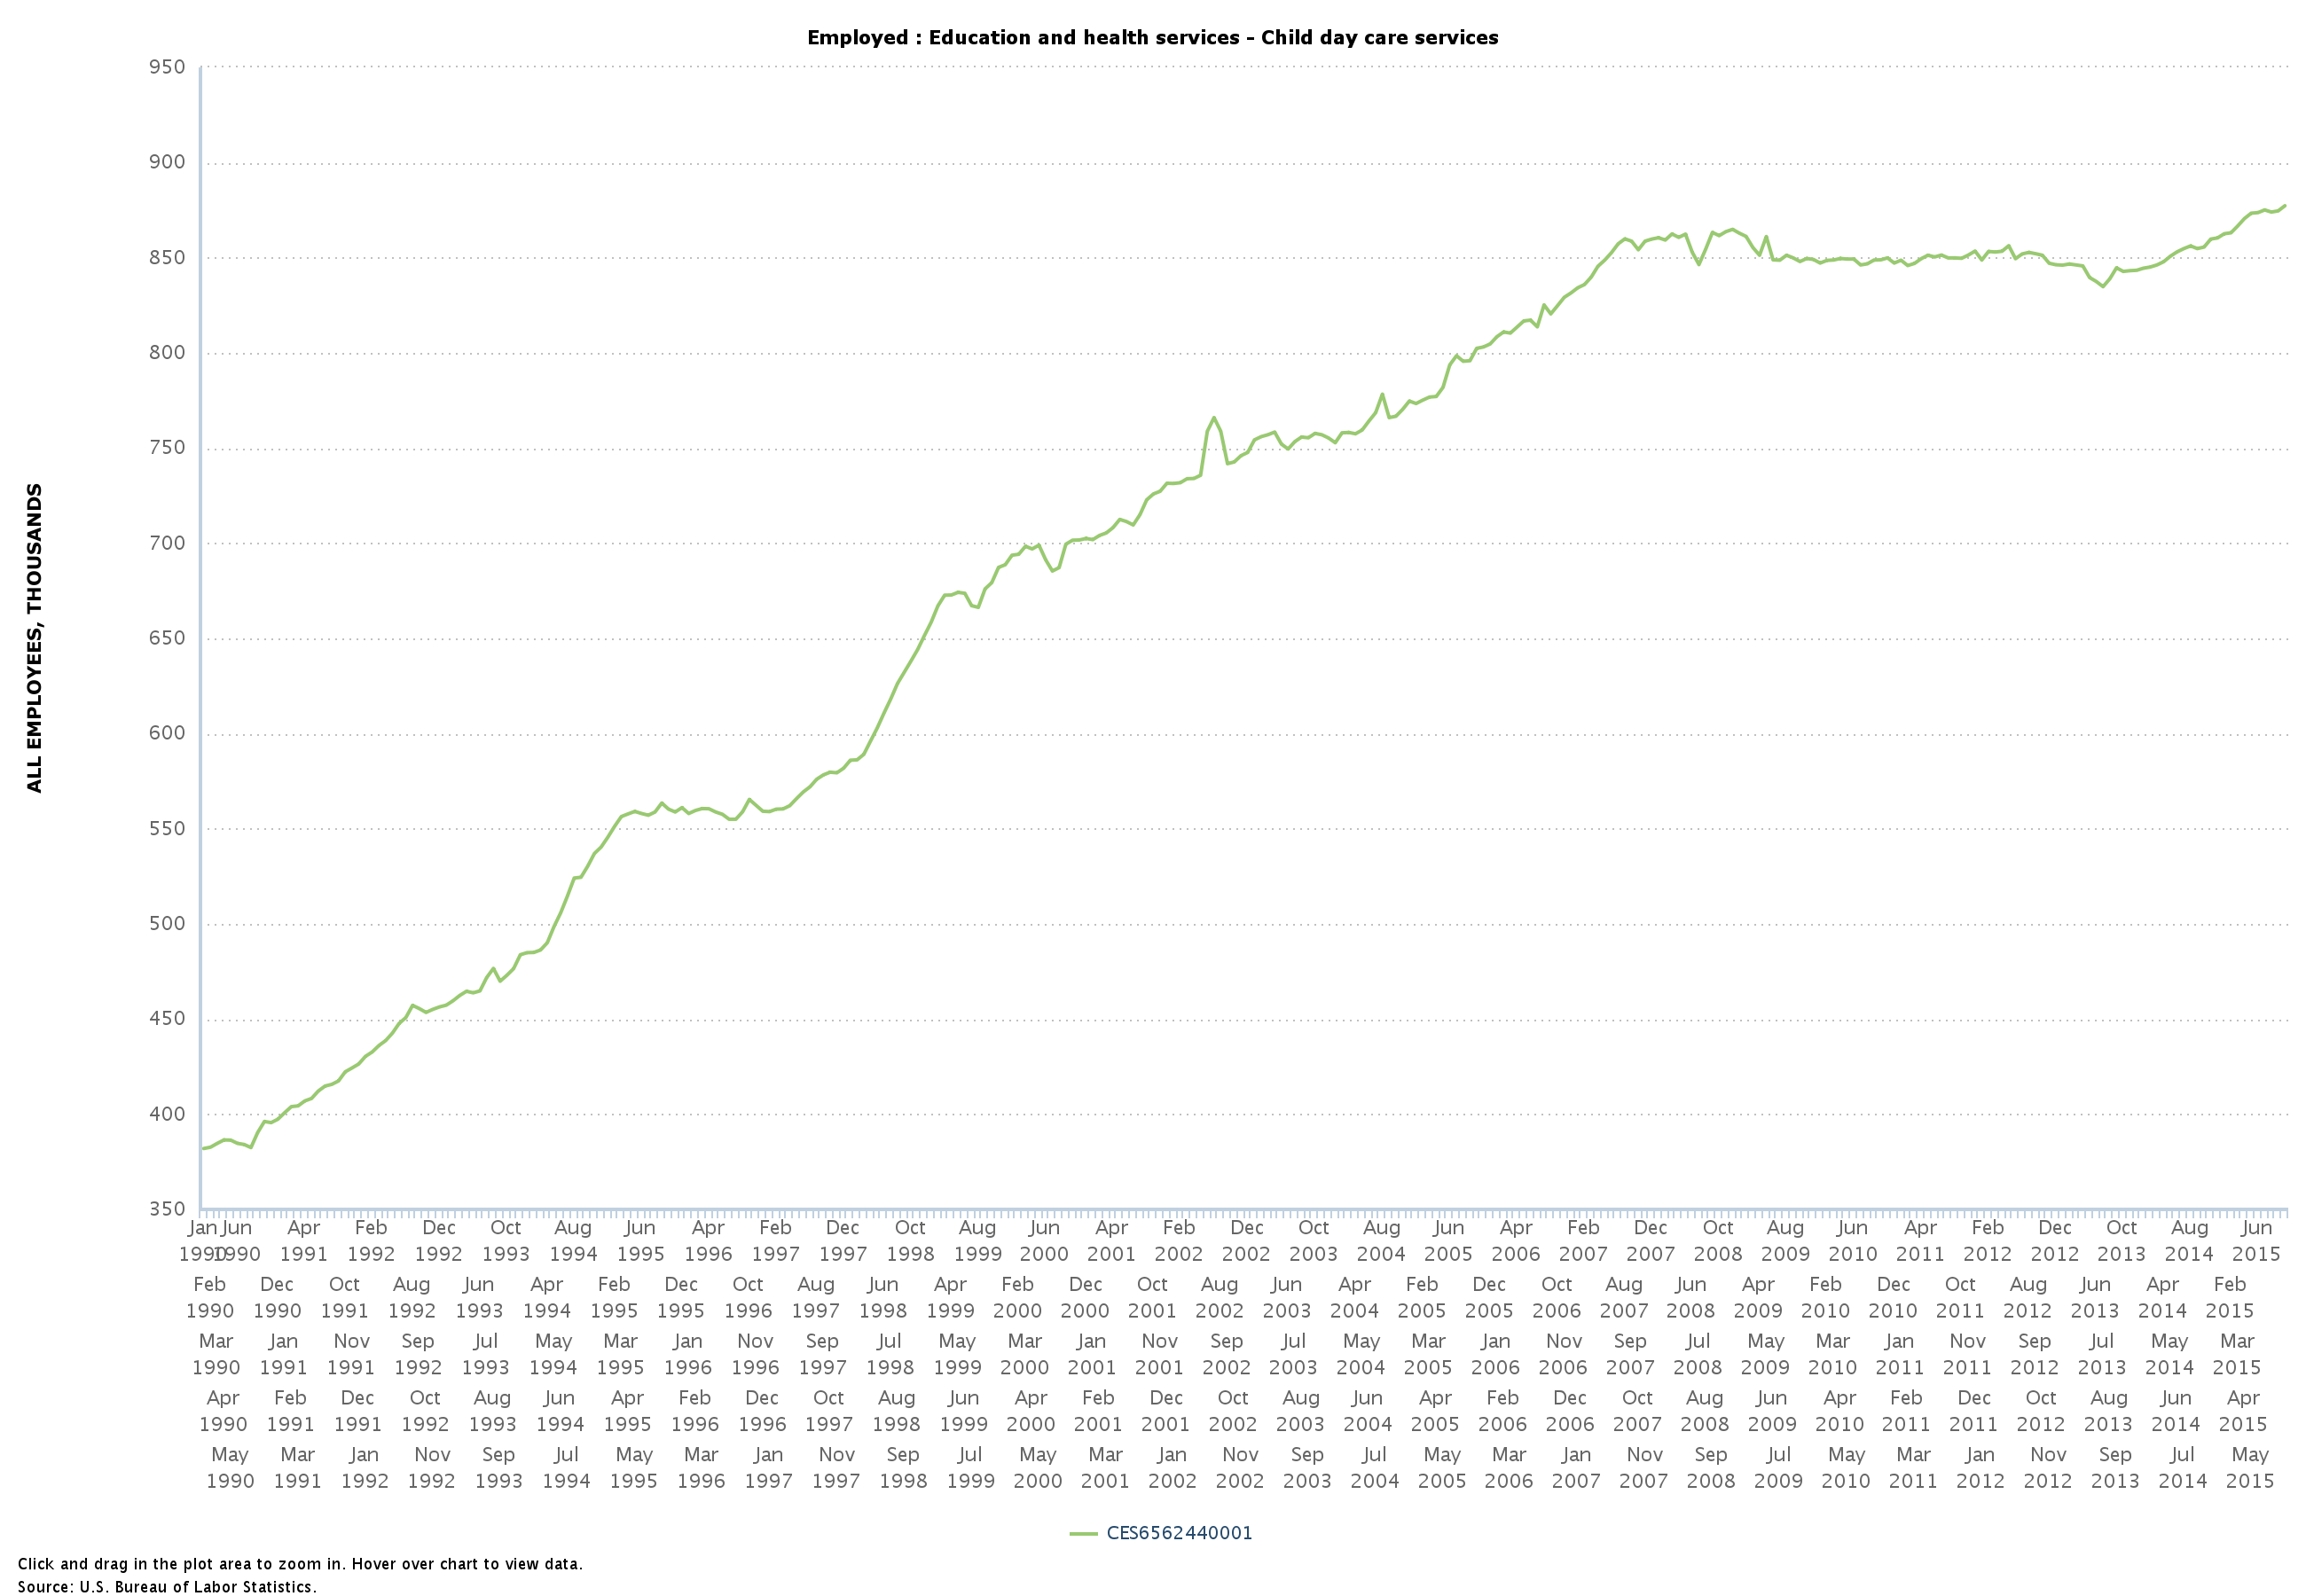
Nor does that exhaust the gullibility and mendacity of the main stream commentariat. The same "MarketWatch" article quotes an economist who cites a slight uptick in day care center jobs as a sure-fire sign that the US economy is about to surge.
Economist Bernard Baumohl of The Economic Outlook Group sees evidence a robust U.S. economy in an even quirkier place: day-care centers. He points out that hiring at day-care centers jumped by 2,700 to a record 877,300 in October.Really? What would scribblers like Baumohl do without media shills like Bartash? Does 25 years worth of data on government subsidized day care jobs show any sign of acute cyclical sensitivity?
“Typically, a rise in day-care employment indicates that more parents are finding jobs and have made arrangements to leave their young children at these locations,” he wrote in a report.
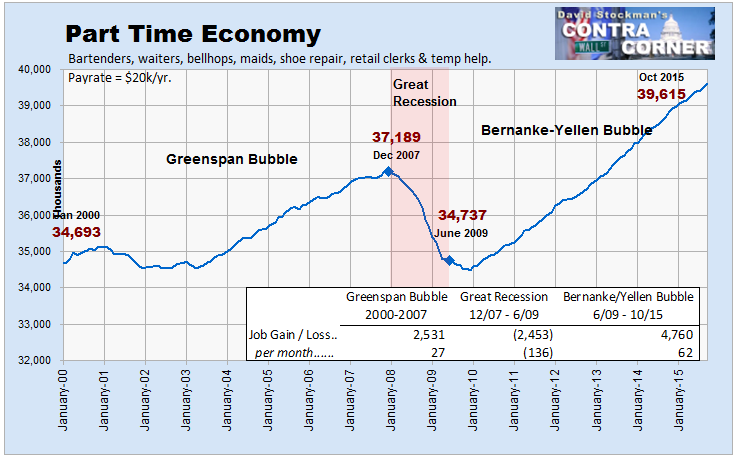
In any event, last month also saw a gain of 44,000 retail clerks and 25,000 temps. So if you add these categories plus household and personal service workers to Leisure and Hospitality you get a broad grouping I’ve labeled as the “Part-Time Economy”.
In a word, last month’s results were essentially the story of the 21st century to date. The BLS survey posted 119,00 more of these jobs last month, and has gained 5 million of such jobs slots since January 2000.
Yet since these gigs annualize to less than $20,000 per year or just 40% of the median income what does a modest uptick here have to do with the real jobs story? That is, with the steady bleed-off of real full-time, full-pay jobs during that same 16-year period?
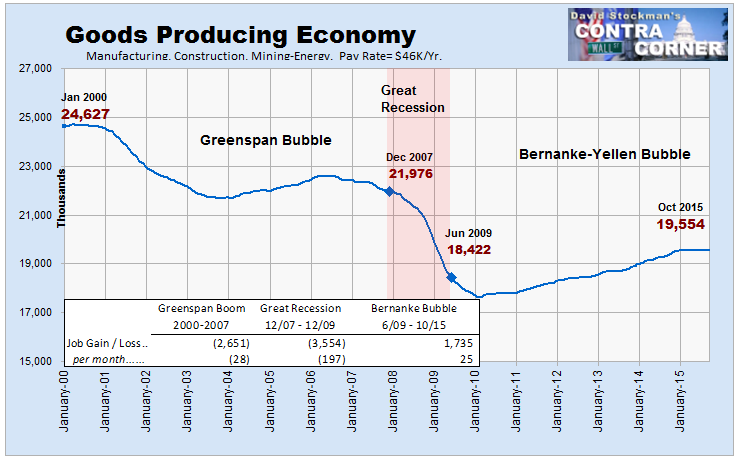
In fact, now that the oil patch is going south and the US dollar north, even the tepid recovery in goods producing jobs has flattened out. Last month there were purportedly 19.554 million goods producing jobs or slightly less than the 19.560 million jobs reported last February when the factories and construction sites were allegedly shutdown due to the purportedly extra real bad winter weather.
Yet if February 2015 is the high water mark for this cycle, as seems indicated by the trend of the dollar and oil prices, we are still 11% below the December 2007 peak and 5.1 million or 21% below the January 2000 level.
Stated differently, the real news Friday was that the productive core of the US jobs market has hit stall speed at a point that is shockingly below where it stood when Bill Clinton was still chasing interns around the oval office. The main stream didn’t notice that, either.
The full story behind the job count divergence as between the Part-Time Economy and the Goods Producing Economy is actually worse than implied by the above charts. That’s because the establishment survey’s all-jobs-equal metric is utterly ridiculous in today’s gig-based economy.
The typical manufacturing job averages nearly 41 hours per week, for instance, while a high share of the part-time jobs generate hardly 20 hours per week of paid work.
Utilizing the BLS’ hours based indices, therefore, you can see an even more egregious deterioration in the quality mix of jobs. Just in the last nine years, employment hours generated by the manufacturing sector have declined by 11% while hours in leisure and hospitality have gained 18%.
The divergence shown below, therefore, captures the true stack of labor market conditions under the noise-ridden top line. The word “blow-out” does not immediately come to mind.
 The same deteriorating picture emerges on a pay-weighted basis. The information technology category includes motion pictures, publishing, broadcasting, telecommunications, data processing and related industries. Average pay rates in October for this category of breadwinner jobs was $35.36 per hour or 2.5X the $14.39 average rate for Leisure and Hospitality.
Needless to say, there was nothing awesome about the 2.8 million jobs reported for this category in October. It is still 25% below its early 2001 level.
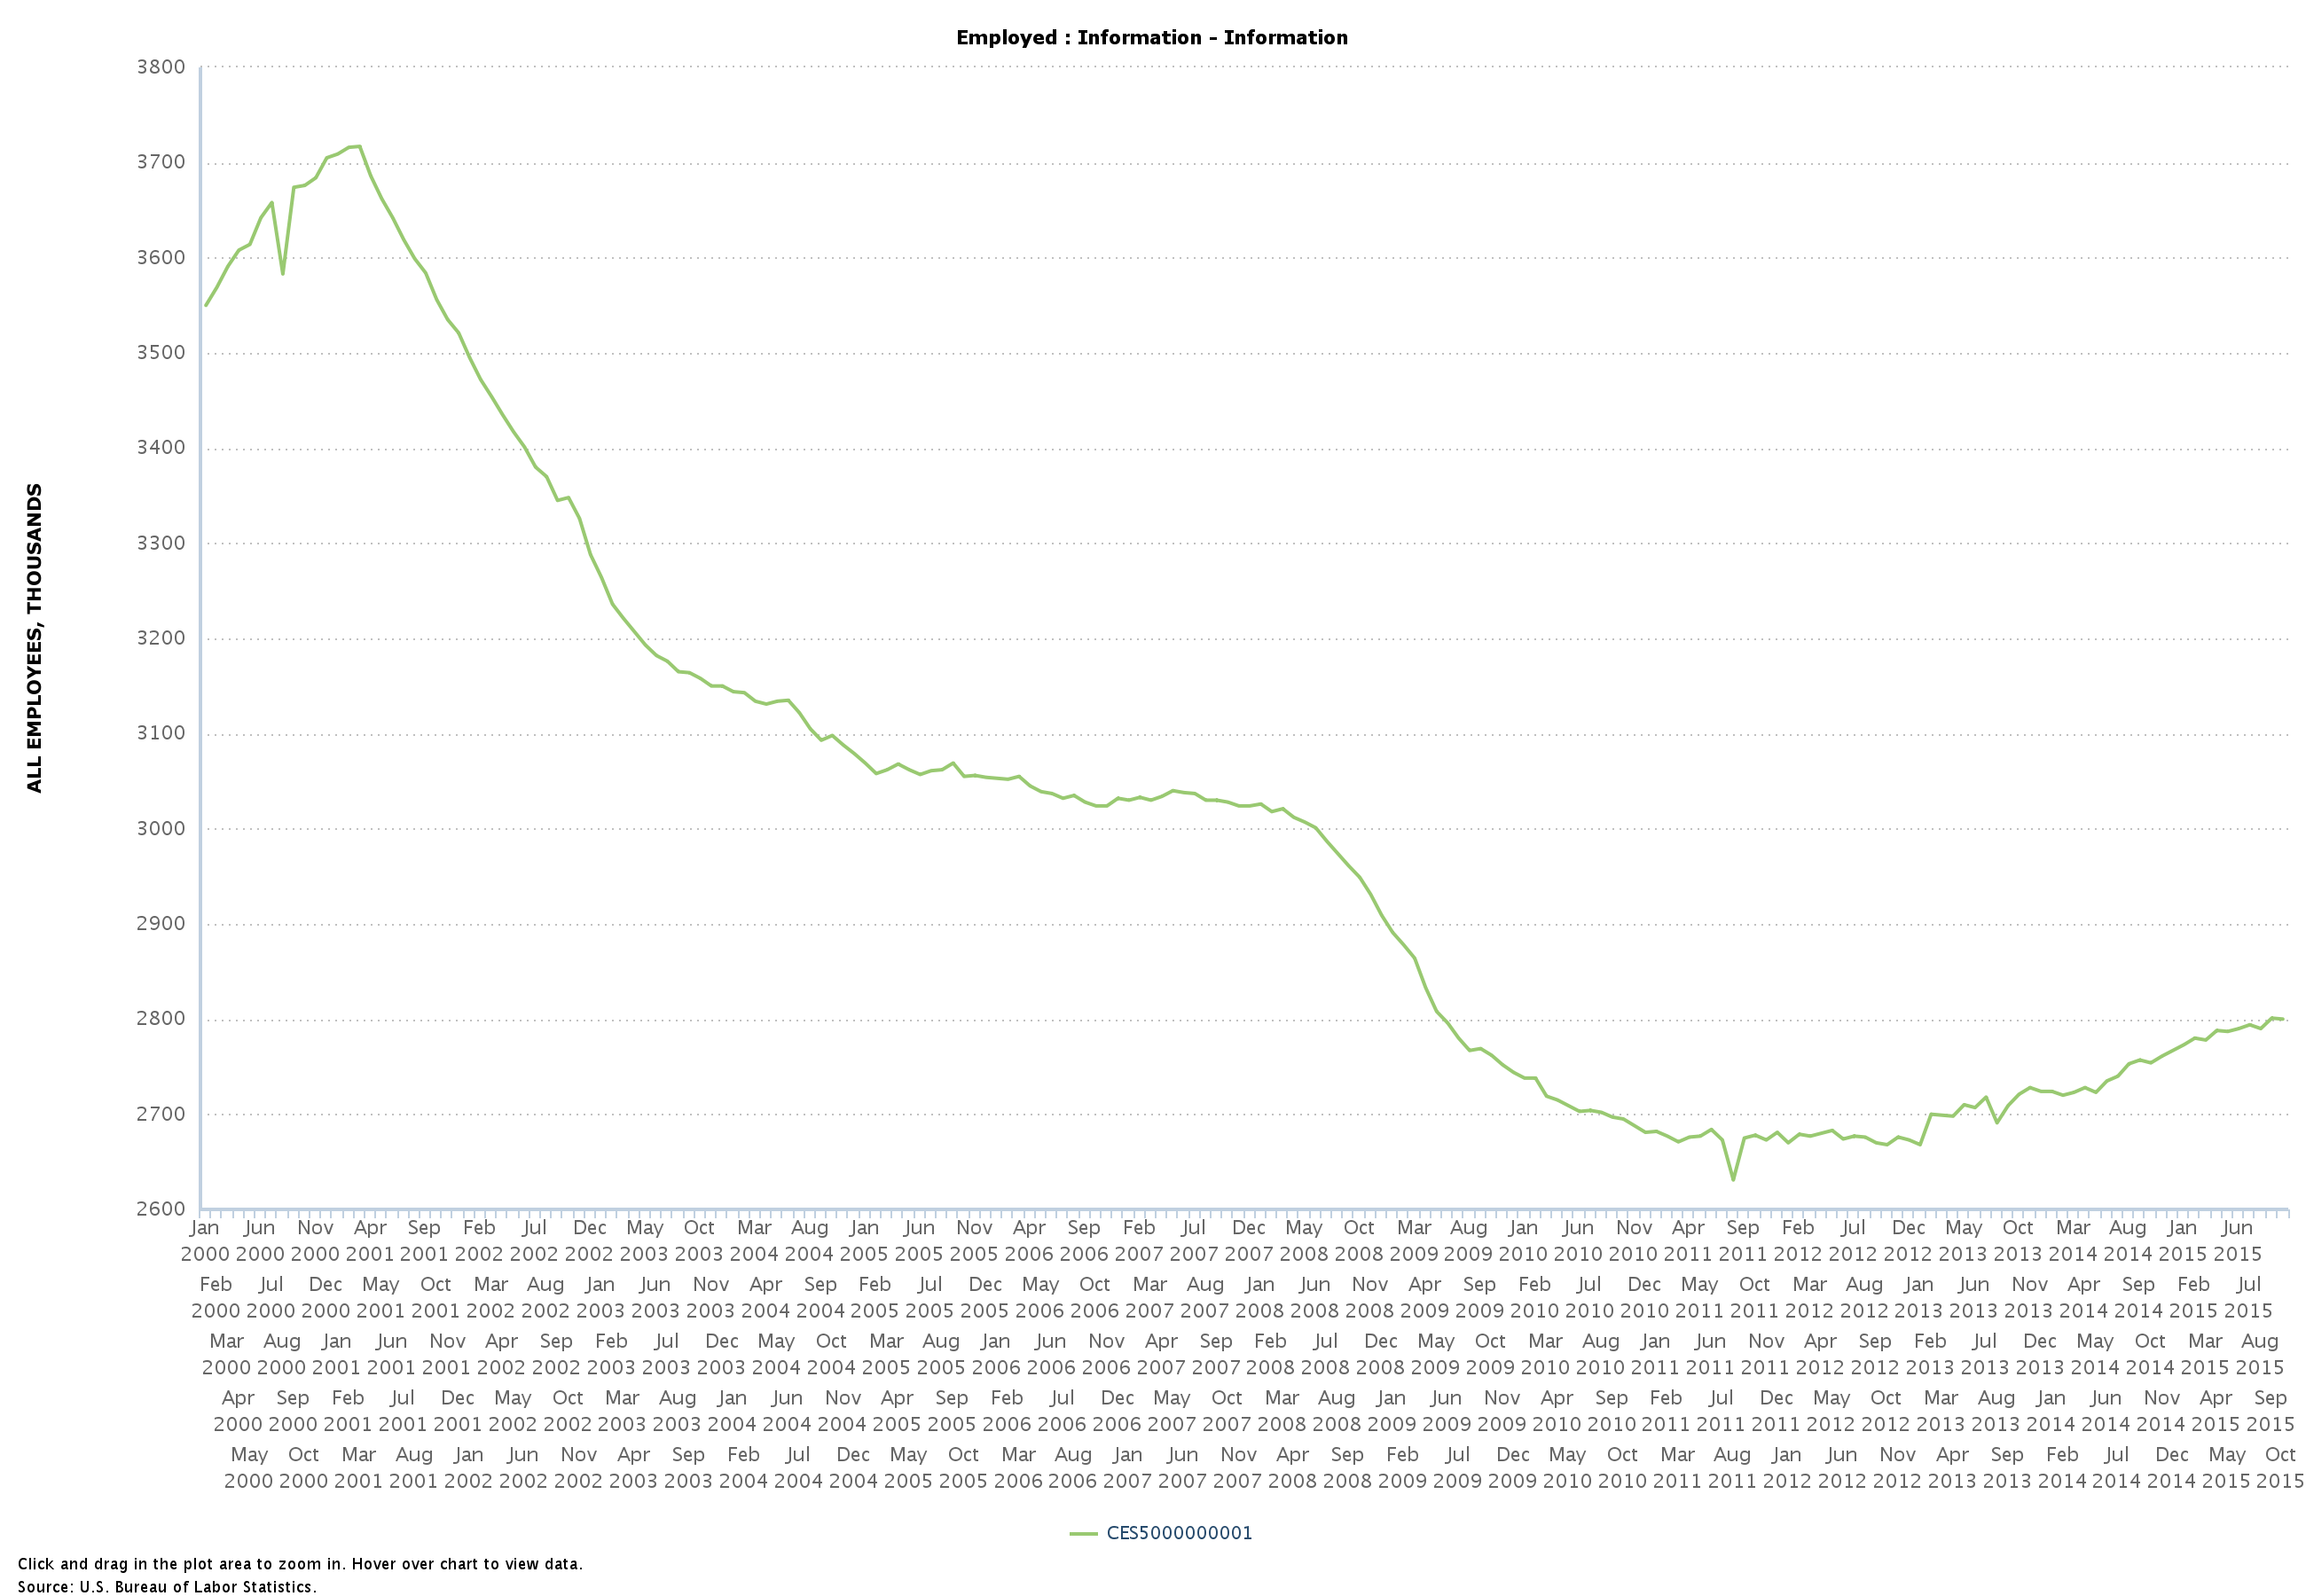
Information Jobs
The same thing is true in the definitely non-smokestack category of computers, semiconductors, peripherals, communications equipment and electronics within the manufacturing total. The not-so-good news in the October report was that the 1.054 million jobs in this category represented a 7% decline from the recession bottom in June 2009!
That’s right. Employment in the core technology sector of the US economy is still going down; and it has been since 1998, when the category job count was 75 percent higher.

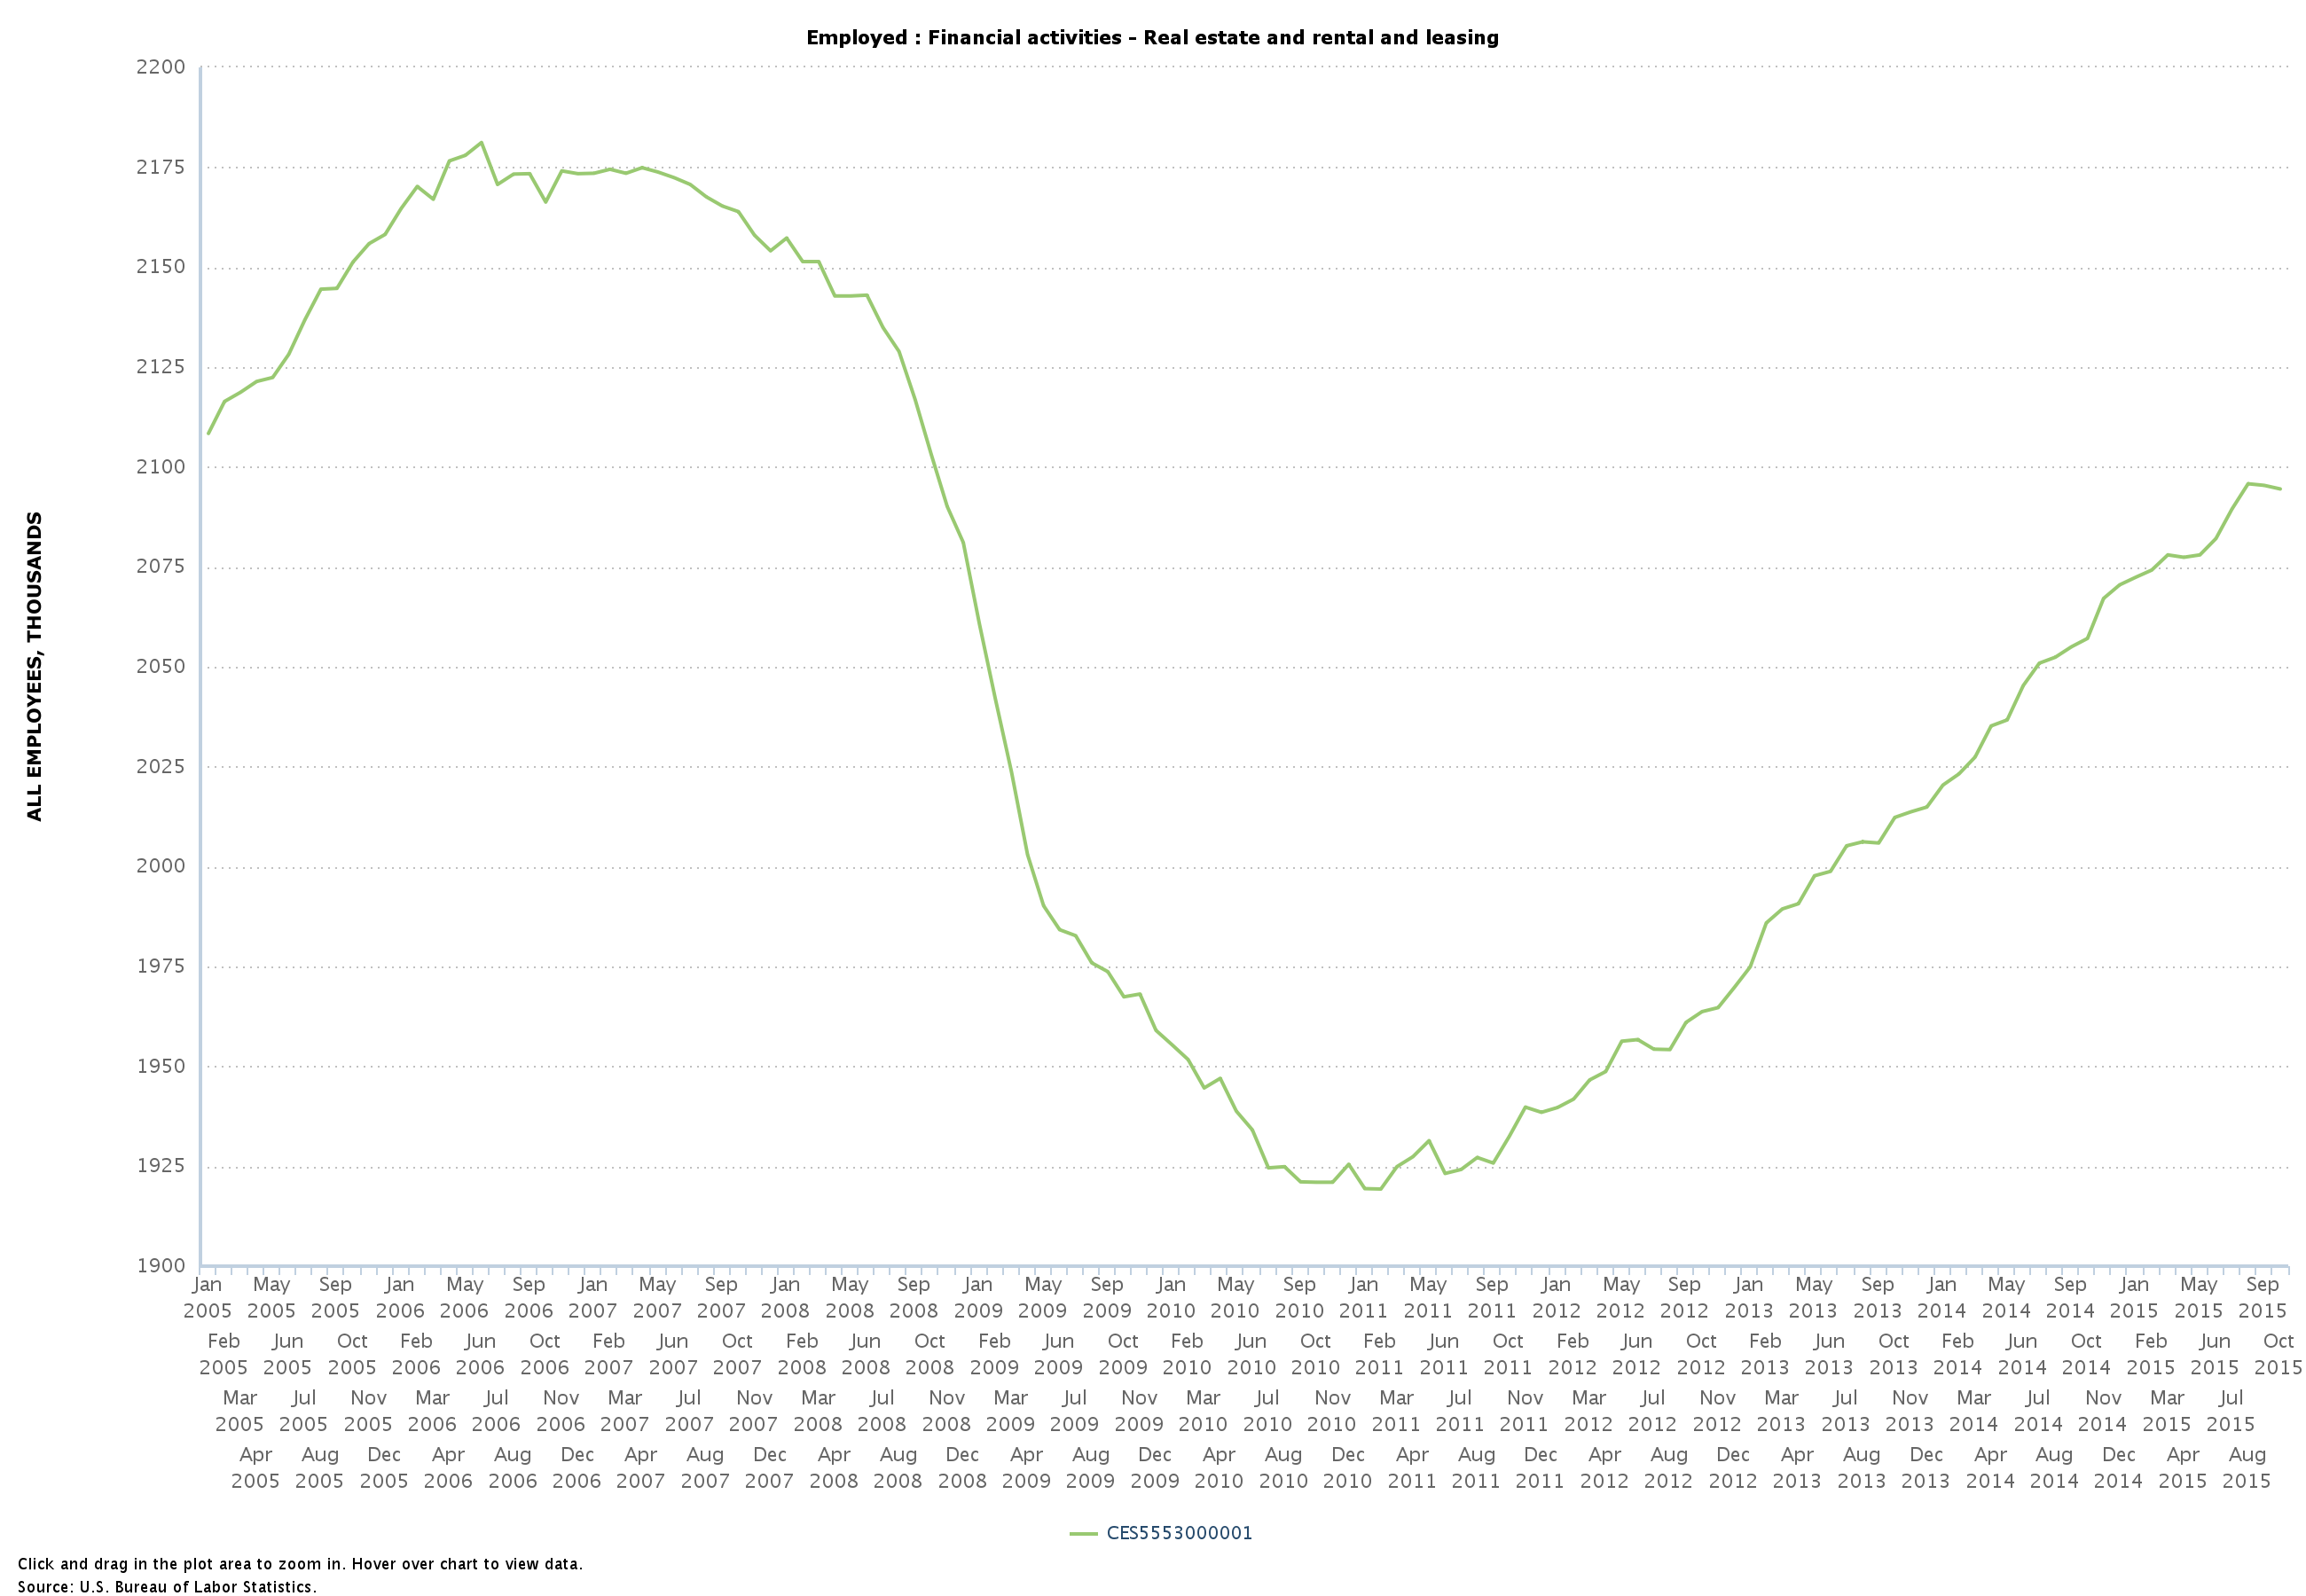
Then there the morning after effect of Bubble Finance. Annualized pay rates in the real estate sector average well over $60,000 per year, but that golden goose was strangled by the Fed housing bubble and bust. Notwithstanding the lowest mortgage rates in history and the Fed’s egregious monetization of more than $1 trillion of GSE mortgage debt, the October count of 2.095 million jobs in real estate and leasing was still 4% below its 2006 peak.
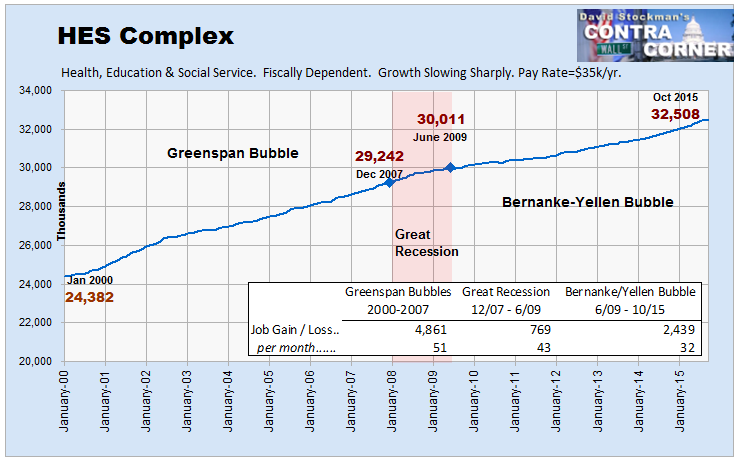
Finally, there is the matter of how jobs are financed and its relationship to Fed policy. It is surely evident that massive money printing and 83 months running of ZIRP have done nothing for the goods producing economy or breadwinner jobs generally. But there has been a strong 2.5 million gain in health, education and social services jobs or what I have termed the HES Complex since the pre-crisis peak, including a print of 58,000 jobs in October.
But that’s exactly the rub. These sectors are overwhelmingly fiscally dependent. That includes upwards of $2.5 trillion of state and Federal Medicare, Medicaid and other health care spending, as well as $200 billion per year of tax preferences for employer paid health insurance.
Stated differently, hospitals, nursing homes, physicians and other health service vendors spend what they can collect from government entitlements and insurance policies, not because interest rates are at insanely low levels. Indeed, monetary policy is virtually irrelevant to hiring trends in the HES complex because even the theoreticians of the Eccles Building have never described a transmission channel by which cheap credit drives spending in the health care system.
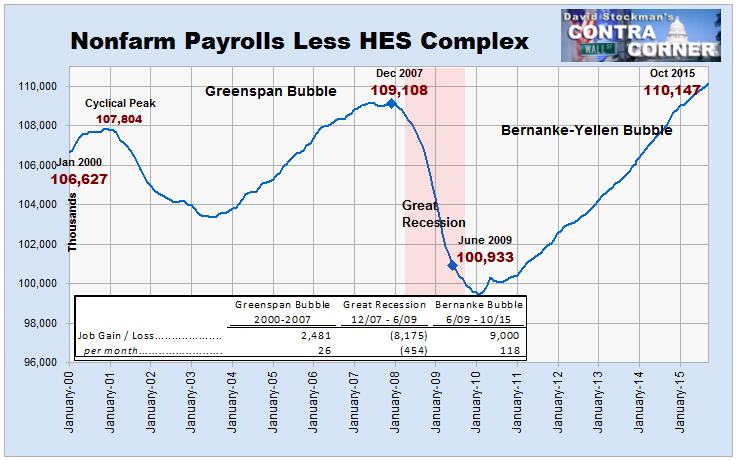
At the end of the day, the picture below says it all. Notwithstanding the Fed’s shift to monetary radicalism after the dotcom bust — what would have been called crackpot economics before then — the expansion of its balance sheet by 9X since the turn of the century (from $500 billion to $4.5 trillion) has generated virtually no net job growth outside of the HES Complex, and even those gains have been in the low-paying Part-Time Economy.
There is absolutely nothing awesome about that, nor about the Fed’s destructive attempts to make it better. In fact, when the current ZIRP/QE fueled financial bubble splatters it is virtually certain that the line on the chart below will plunge once again to its turn of the century level.
Stated differently, as the coming recession unfolds the Fed will have succeeded in crushing both savers and workers at the same time. Maybe then the torches and pitchforks will converge on the Eccles Building……..at last.


No comments:
Post a Comment